Cafeterias, from a time and cost efficiency perspective, are superior to made-to-order food services. We can apply that same “Grab-and-Go” concept to student data – providing real-time analytics and insights that truly support every child, every day.

The origins of cafeterias as a food service concept can be traced to the 1880s. The New York Exchange Buffet is thought to be the first restaurant to adopt this innovation. The National School Lunch Act of 1946 set the stage for the creation of school cafeterias.
Schools in the 1950s began the widespread creation of school lunchrooms and cafeterias as a food service method. Cafeterias were one of the first self-service business concepts. They have the advantage of allowing a few to serve many with extreme efficiency. School cafeterias prepare and serve hundreds of meals in a short period of time with a relatively small staff. Students select their meal choices, transport their food to tables, and then deliver their plates and cutlery to the dishwashers. Cafeterias, from a time and cost efficiency perspective, are superior to made-to-order food services.
Fast-forward to Self-Serve Data
In 2021, access to student performance data is still mainly on a “made-to-order” basis. Service providers are often the spread-thin school IT workers. With the explosion of computers in the classroom and digital curriculum, the IT team finds themselves no longer in the background but instead on the frontline in the delivery of essential teaching services. With the move to online classes following the COVID-19 pandemic, even greater demands are being made on IT.
Customer self-service is one of the hallmark achievements of the web and yet most organizations are yet to apply this concept to data.
Most data is trapped in silos (apps) and inaccessible to all but those who have the permissions, skills, and software to access raw data and make sense of it. In many cases, that means IT needs to be called in to complete the reporting picture. Most reports utilize data found in multiple apps. In order to use data together from multiple sources, it must be collected in a central location and structured in a common format creating interoperability and comparability. Think about the simple case of comparing student scores from a State administered math assessment to their grades from math class. The State data comes in a nicely formatted file with student names and ID numbers. The grade data comes from the local SIS with student names and ID numbers. All you need to do is match the ID numbers somehow. Sounds good, right? Except when you realize State data and the local data use different ID numbering systems. Now what?
Neither teachers nor IT staff have much extra time. Most educators recognize the importance of making data-driven decisions for the benefit of their students. Performance data for students resides in many disparate applications. A manual “made-to-order” approach to data distribution means that for every request, someone must collect data from disparate sources and then organize it into a report. This type of data delivery has a significant disadvantage in that it introduces many manual steps and thus creates many opportunities for human error. In addition, after the time-lag between sourcing the data, combining it, getting it right and final delivery to the consumer, the information is almost certainly out of date. Fulfilling report requests this way is a slow and cumbersome process and competes for resources from other vital services, forcing greater attention to demand management policies.
What manifests is an odd situation such that there is an inverse correlation between the human effort to produce a report and it's ultimate value.

The result is what we see in most schools today: the difficulty and level of effort in gaining access to good data deters the ongoing use of data and therefore data-driven instruction. Now more than ever, cost-efficient methods are needed to serve data at scale. Self-service and system automation will recover valuable IT human resources already spread thin and turn the idea of using data to advance learning into a reality.
A Vision for the “Data Cafeteria”
The rapid creation and introduction of instructional tech during the pandemic has created an explosion of data, but the key is putting it to use to address the learning loss and equity gaps we read about in the news every day.
Student data should be integrated – automatically and continuously collected, organized, and loaded into data views that support analysis of educational objectives at all levels.
Access should be provided through a simple and easy-to-use interface. The “data cafeteria” should always be open to its customers stocked with real-time data. No longer should educators need to request reports and spreadsheets be prepared for them. Instead, they should be able to digitally “Grab-and-Go.”
Building a Real-Time Data Service
The first steps in building a real-time data service are similar to how nutritionists design the menus for school cafeterias – school leaders should identify the benchmarks that they want their teams to work towards and clearly identify student performance goals. It’s worth noting these goals could span a broad range of data categories: academic, behavioral, attendance, engagement, social, emotional, etc.
Identify your goals
The objective here is to identify metrics that can be used to track progress toward addressing specific problems or strategic goals important to your schools. Think about goals outlined in your school or district level annual or 90-day plans or both. For example, let’s say you want to address a concern about chronic absenteeism for English language learners at one school and reading proficiency among minority students at another school. Defining “success” in these cases may be straightforward or a nuanced and collaborative effort. This definition process is key as you will see in what happens next.
With specific objectives and a data-informed definition of success, you have the fuel to drive the next part – implementing and using a data service. There are two critical activities involved in this effort: system implementation and building a data culture.
Implement your data service
System implementation involves identifying an internal team to validate and likely an external partner to implement. The internal team will include your IT, accountability, and school leaders who will ensure the right solution is identified and implemented. Your external partner will have experience with deploying student performance analytics in schools. They will work with your internal team to ensure anything deployed not only meets the immediate objectives previously defined but is also flexible enough to address those questions you haven’t asked – in a manner intuitive to your end-users.
In the past, this kind of effort was daunting and only undertaken by large districts with serious IT budgets. The good news is there are powerful solutions in place today which are within reach of even the smallest school districts from a time, cost, and effort standpoint.
Build your data culture
Building a data culture is all about organizational change management. Think about the days before the cafeteria or its ubiquitous cousin, fast food. If you knew nothing but table service, the idea of self-service was an unknown you would probably avoid. When you collaborated with your teams to define “success” around certain metrics, you started the process of building the data culture and removing the fear of the unknown. You were generating a shared commitment to the idea that data will define success. Your system implementation partner should understand this. Beyond just rolling out software, they should be ready to provide the leadership coaching essential to helping you build a data culture. Check out this link to get a better understanding of data culture.
Reaping the Benefits
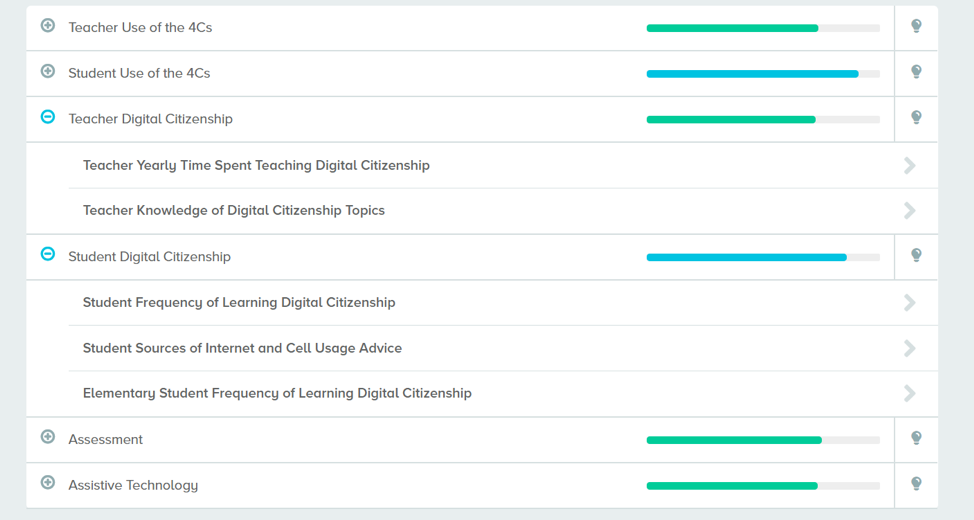
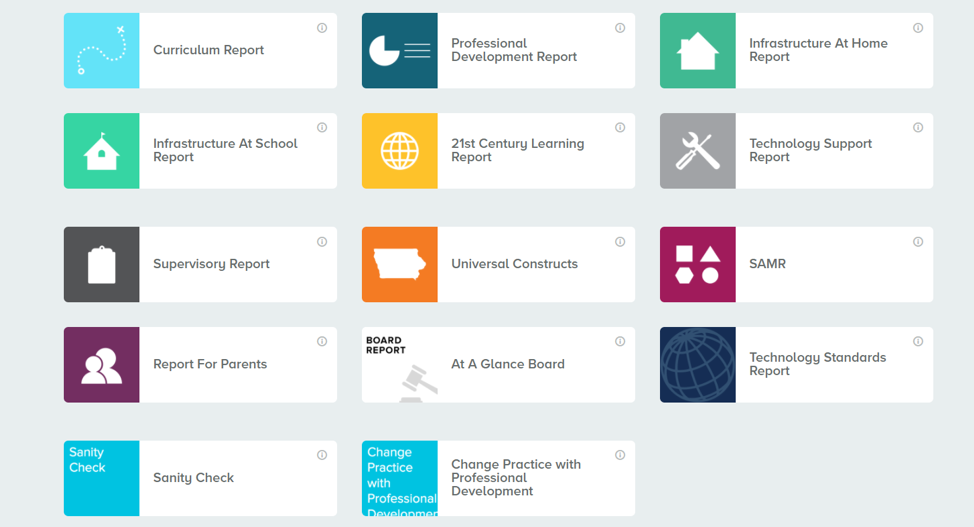
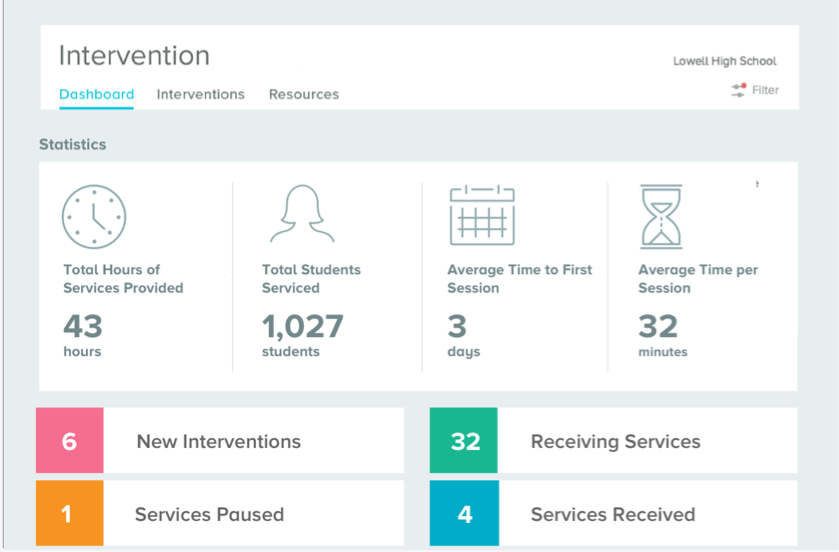
The initial build-out of a data system will take some time to accomplish, but it should not take too much time. The benefits are both immediate access to the information that educators need to make real-time instructional decisions combined with the elimination of thousands of requests to IT for that very same information. Once data is collected and organized in a central repository, countless insights can be provided continuously and automatically on a self-serve basis. A few views that can be particularly useful are multi-year individual student data portfolios; peer comparisons; and subgroup comparisons.
As schools advance from primarily using data to meet compliance requirements, the promise of providing navigational insights to align school action in support of the education of every child every day will finally be realized.
![]()
Provided by ReadWrite Digital, a Virginia-based Student Performance Management Solutions company with a dedicated mission: We Make K-12 Education Data Easy. Our team of professionals has decades of experience on the front lines of Education and Technology. Visit our blog to read more insightful K-12 Education Data and Leadership news.