• Skip to main content

VSTE

Virginia Society for Technology in Education

  • About
    • About VSTE
    • Committees
      • Advocacy
      • Awards
      • Education
      • Elections
      • Equity & Diversity
      • Finance
      • Outreach
    • Get Involved
    • Leadership
    • VSTE Corporate Council
  • Blog
  • Events
    • VSTE Calendar
    • Annual Conference
    • Annual Conference Archives
    • The Leading Ed Forum 2025
    • Power of Coaching 2025
    • Corporate and Conference Sponsorship Opportunities
  • Prof. Services
  • VCC
  • #VSTE25
  • Membership
    • Subscribe/Join
  • Contact
  • Facebook
  • Twitter
  • LinkedIn
  • YouTube
  • Search

Front Page Middle

4 Google Sheets Formulas That Make You Feel Like a Super Hero and How to Use Them

January 17, 2022 by timstahmer

Spreadsheets are some of my favorite things.  I know that was super nerdy, but what else would you expect from me?  As someone who likes organization, automation, and data calculations, I really enjoy the power I experience from using formulas that help me to do just that!  So, here are 4 of my favorite Google Sheets formulas that make me feel like a super hero!

=IMPORTRANGE

This formula is truly one of my favorites.  I use this formula a lot to pull data from one spreadsheet into a totally different spreadsheet.  Why would I want to use this, you ask?  Let me give you an example.  Suppose you have some amazing data in a massive multi-tab spreadsheet in Google Sheets.  But, rather than sharing the entire spreadsheet with someone, you want to only share the data in one particular tab.  You could always copy and paste that data into a new spreadsheet, but if the master data set is a work in progress, you will want some way to give that person constant access to the current set.  I present to you the Import Range formula!

Import Range takes the data range in that tab, sends it to your new spreadsheet, and constantly updates the data in the new spreadsheet as it changes in the master spreadsheet.  So, here’s the formula:

=importrange("SpreadsheetURL","’Tab Name’!Range of Data to Import")

In the example below, I’m importing data from this spreadsheet “docs.google.com/spreadsheet/12345” and I want to Import all data in the tab named “List1” that has data in Column A - Column E.

spreadsheet example 1
Click on any example to see the full size image.

In my new spreadsheet I’ll use this formula in the first cell of the sheet:
=importrange(“docs.google.com/spreadsheet/12345”, “List1!A:F”)spreadsheet example 1
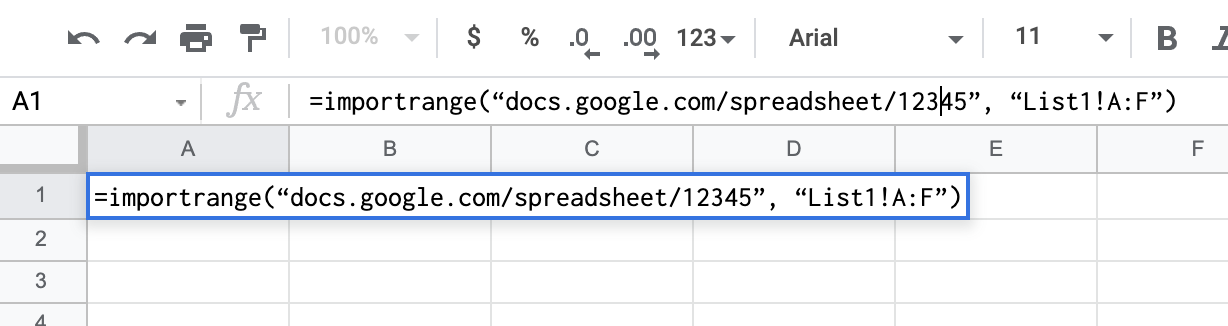
I have to then give permission to use the data in my master spreadsheet from a popup that appears in the cell.

spreadsheet example 3

Viola, I have imported my data set!
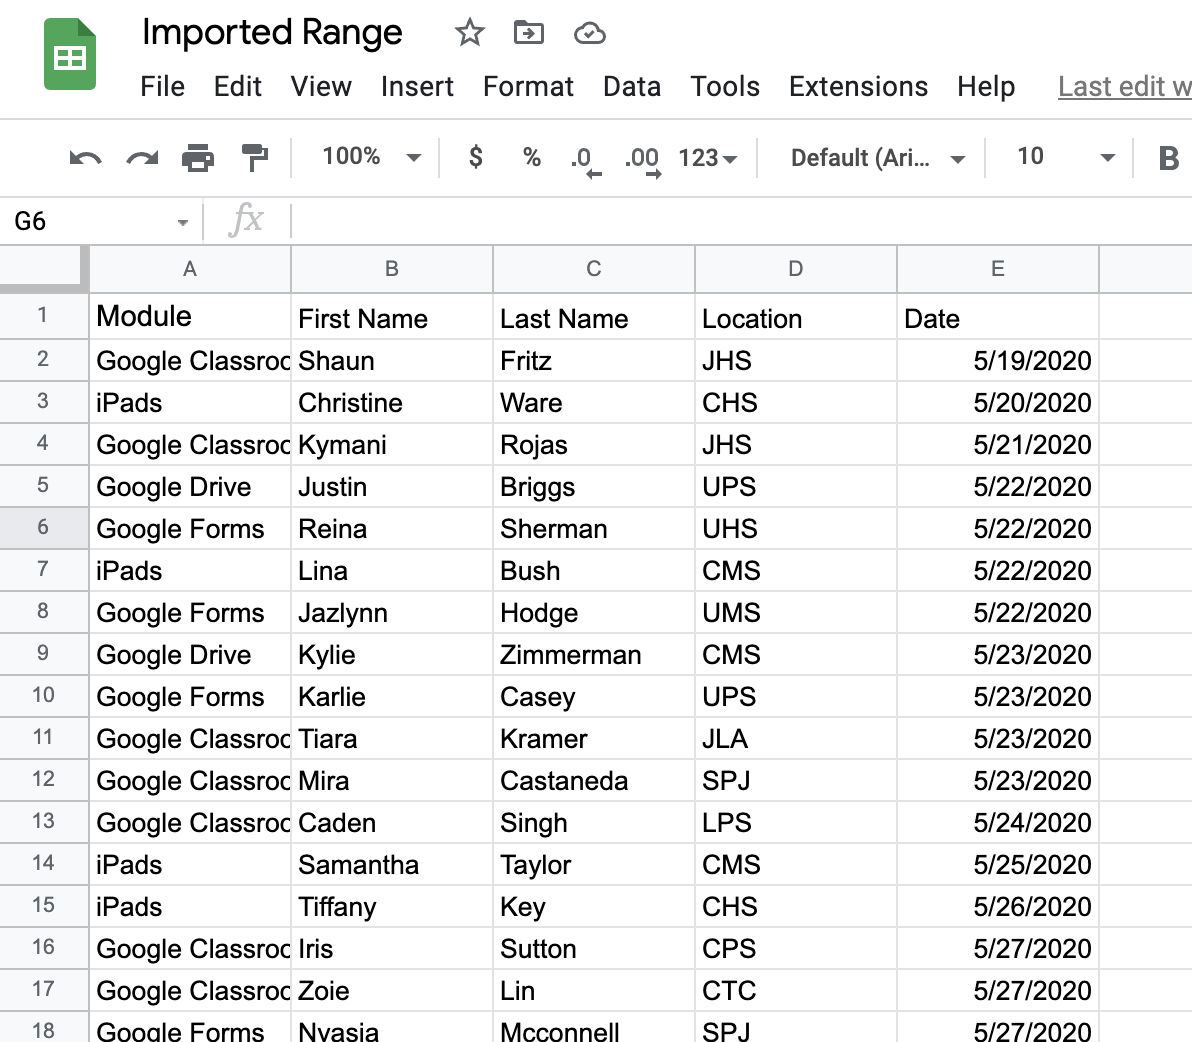
Spreadsheet example 4

=FILTER

Now, for that spreadsheet containing the data I have imported, let’s say I want to create a new tab that contains an automatically filtered listing of people who have completed a particular module.  I can use filter views, but that often means I have to keep turning filters on and off.  There has to be an easier way, and there is, it’s the FILTER formula!

=filter(‘Tab Name’!DataRange,’Tab Name’!FirstSearchLocation:Condition")

I have the sheet of data that I want to Filter by the Module each person completed. I created a new tab called “Google Classroom Only” where I will be working.

Spreadsheet example 5
I will use the following formula in the new tab.

=FILTER(Sheet1!A2:E,Sheet1!A2:A="Google Classroom")

(Note: I tell the formula to start at the first true entry to search, A2.  If you use A:E rather than A2:E, you will get an error message regarding range size mismatches.)spreadsheet example 6

I now have a filtered listing of only those who completed the Google Classroom Module.spreadsheet example 7

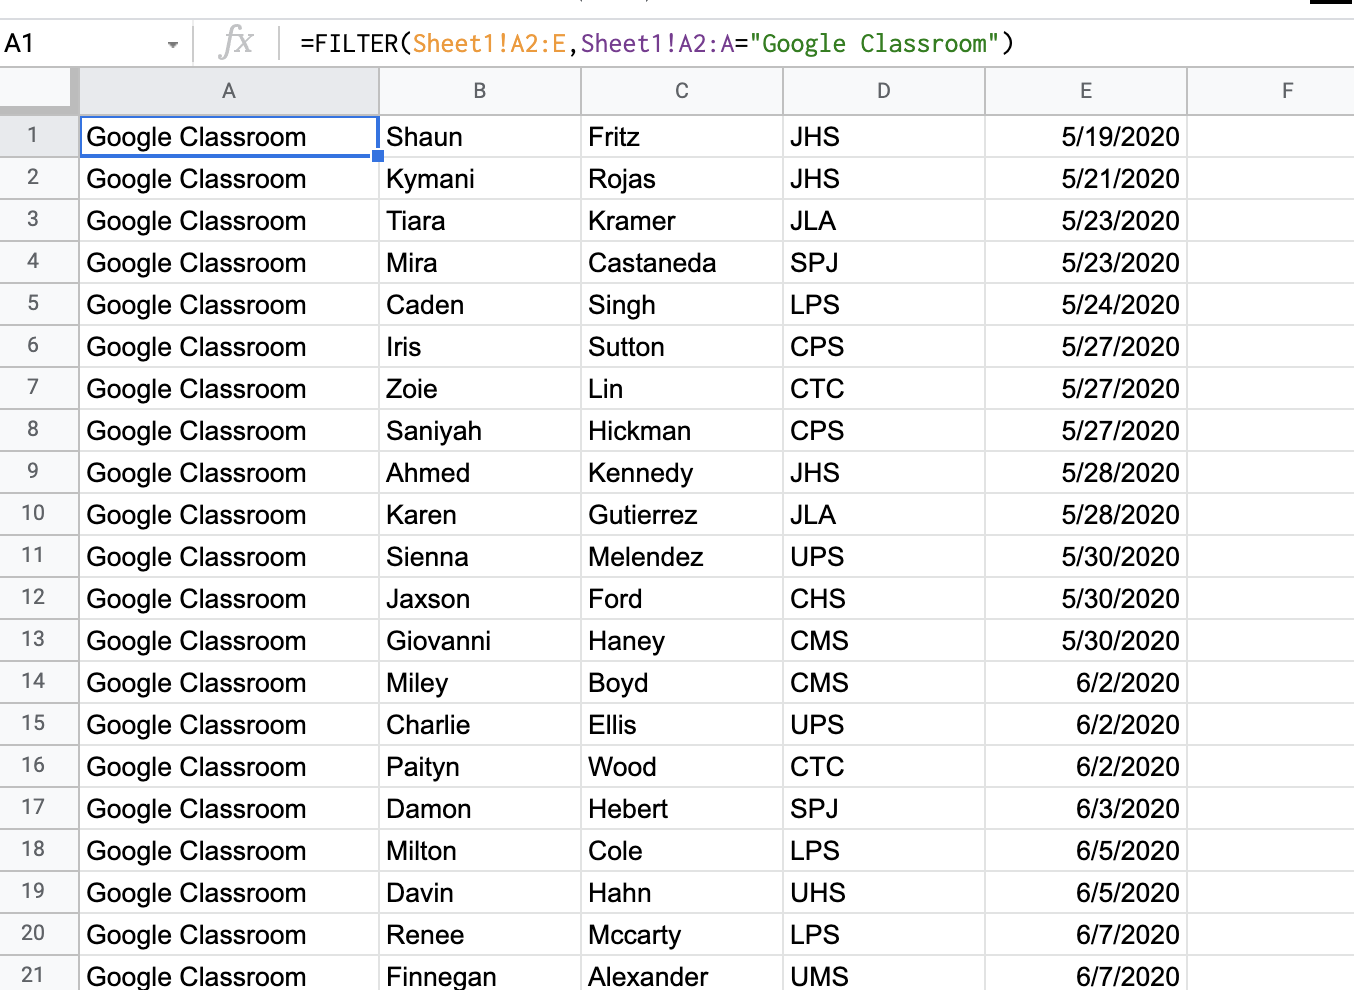
I can now use the same technique to make a new tab for each module to better organize the data.

=LEFT & =RIGHT

These awesome formulas allow you to truncate data after a certain number of characters starting either from the LEFT or the RIGHT side of the cell.    The formula looks like this:

=LEFT(Cell, Number of characters to keep)
=RIGHT(Cell, Number of characters to keep)

In my data set I’ve been using, let’s say I want only the first initial of everyone’s first name.spreadsheet example 8

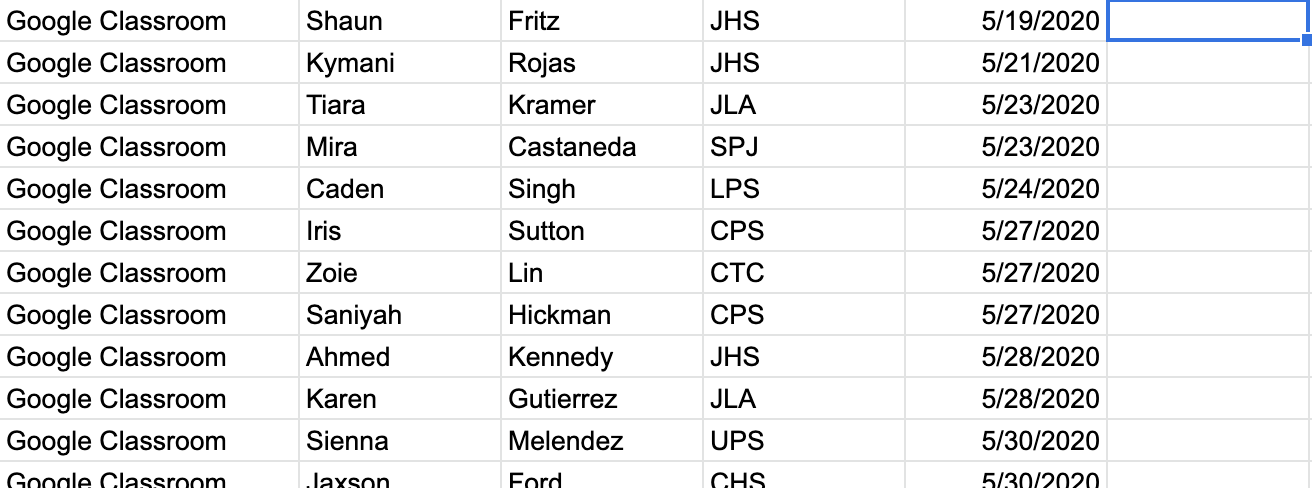
Since I’d be starting on the left, I’ll use the LEFT formula.  I’ll start with cell B1 and tell it to only keep one character:
=LEFT(B1, 1)spreadsheet example 9
Once I get the desired result, I copy and paste that formula down the column to have it match up with the associated rows.
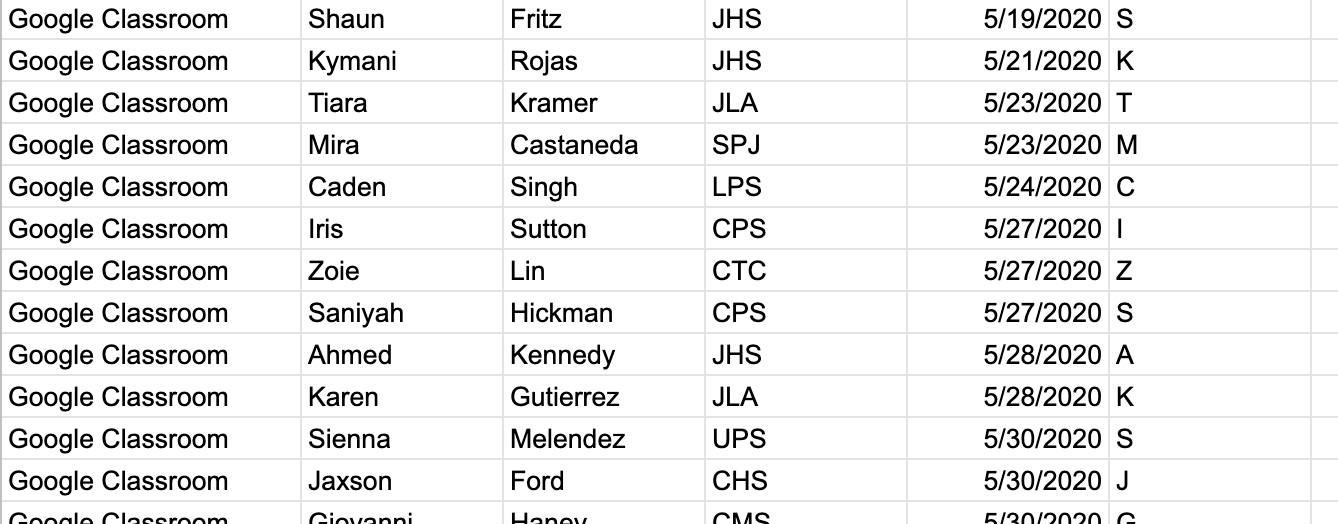
spreadsheet example 10

=LOWER & =UPPER

Sometimes I need to remove the capitalization of words or names, especially in cases of assumed usernames.  The Lower and Upper formulas allow me to do just that:

=LOWER(Cell)
=UPPER(Cell)

In my data set, I want a column of all of the first initials as lowercase letters and a column of all of the last names in lowercase.    To do this, I’ll use the Lower formula twice.

I’ll start in cell F1 since that’s where my initials begin.  I’ll use this formula in the Cell G1:

=LOWER(F1)spreadsheet example 11

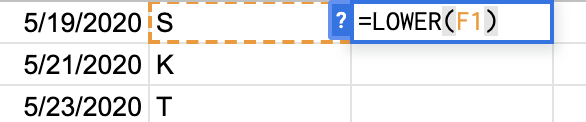
Now I can copy and paste both formulas down the columns to get my lowercase versions of the data.spreadsheet example 12

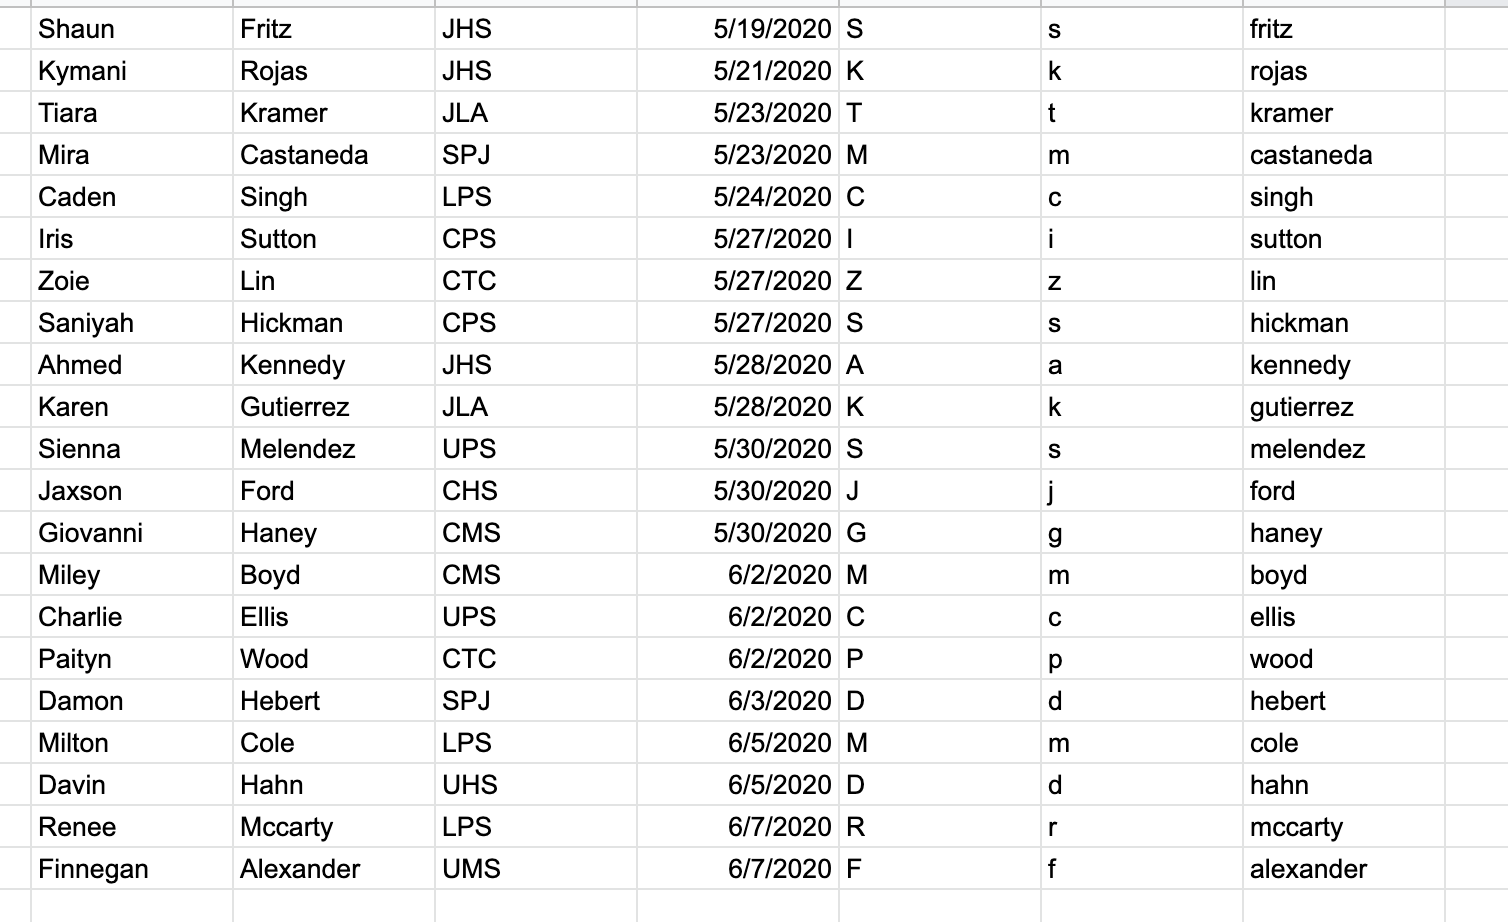
Spreadsheets are amazing and can make you feel extremely powerful when it comes to organizing your data.  You can check out some other awesome spreadsheet formulas for Google Sheets on the Google Sheets Function List.


Written by Daniel Vanover. Daniel is a Technology Coach for Wise County Public Schools and is a Google Certified Educator, Trainer, and Administrator. You can connect with him and get more information on his website.

Share this:

  • Email
  • Tweet

Filed Under: Blog, Front Page Middle, VSTE Voices Tagged With: formulas, google, spreadsheets, tips

Your LMS isn’t JUST for virtual learning!

December 20, 2021 by timstahmer

As we take a moment for a much-needed rest, we may not be thinking much about instructional plans for those inclement weather days that now seemed to be called “virtual learning days” in some areas. Don’t worry! Your VSTE friends have got you! The VSTE Regional Advisory Council, best known as the VSTE Coaching Crew is a new statewide council aimed at building capacity for virtual and blended learning in each region of the state. This magnificent, not at all motley, 'crew' of technology leaders works to strengthen online presence in Virtual Virginia by expanding our digital PLN, and by partnering with VVA and Instructure for monthly webinars. But that’s not all!

At this month’s VSTE conference in Roanoke, The VSTE Coaching Crew debuted a cool new and ever-expanding resource guide aimed at helping you use your LMS in your instruction every day! The best part of that is that when those inclement weather days hit and we do another “PIVOT!”, then you are all set for learning! Take a look at over 40 Ways to Use Your LMS for ideas, strategies, and some killer resources to help you design and implement seamlessly blended instruction. These resources will also help you to streamline your in-person instruction as well all while sharpening your students’ technical and content knowledge skills.

graphic showing photos of the members of the VSTE Coaching Crew

Let’s explore a few of those great ideas shared at VSTE! Coaching crew member Ann Nash from Henrico County in Region 1 shared a great idea to create virtual “Gallery Walks” with digital artifacts giving students a place to display their work proudly. Gallery Walks can also be used to help students synthesize their research and presentation skills and offer a collaborative space for reflection and feedback. Learn more about this strategy in the Strategy #3 Resource Guide!

Coaching crew member Patty Gilham from Manassas Park City in Region 4 shared a cool idea to help your little learner navigate your LMS with ease! She suggested using emojis and buttons for a visual representation for young learners who are unable to read allowing them to follow along with the lesson with ease. While she provided examples from her courses in Canvas, this strategy could easily be done with many other types of learning management systems. Learn more about this strategy in the Strategy #21 Resource Guide!

One of my favorite ways to use your LMS in your day-to-day classroom is by presenting content and resources as embedded content. Your LMS can serve as your “home base” of instructional content and support for all of your students. By having your links to activities and resources in one easy-to-access place, you save essential time with one-click access! Want to take your students to a faraway location? No problem, just embed one of Nearpod’s free virtual tours lessons! Your students will be able to explore places like Glacier National Park and many more with or without VR equipment. Learn more about this strategy in the Strategy # 13 Resource Guide!

There are so many wonderful ways to blend your in-person and virtual instruction! The VSTE Coaching Crew is working to expand these resources over the next year. We hope to see you at one of the monthly regional meetings. For more information about the regional meeting times subscribe to the Virtual Virginia calendar, or contact VSTE’s Executive Director, Dr. Karen Richardson at karen.richardson@vste.org.


Written by Heather Askea. Heather is the Instructional Technology Coordinator for the Center for Teaching Excellence at UVA Wise. She is also the Chair of the VSTE Board of Directors. You can connect with her on Twitter @HeatherAskea or by leaving a message on this website.

Share this:

  • Email
  • Tweet

Filed Under: Blog, Front Page Middle, VSTE Voices Tagged With: Coaching, LMS, virtual, virtual virginia

Coaching to Learn: Managing Change and Emerging Technology


December 10, 2021 by timstahmer

My experience with change management comes from a few different industries. For the last six years I have been in education, but prior to that I was in the consumer finance and insurance industries where I found myself constantly surrounded by emerging technology and continuous change. One thing that I have learned to embrace over time is change. Specifically focusing on the things that I am able to influence, and those things that are within my control. I’ve found that investing time an energy, time, and interest into things that you can’t control, leads to burnout, stress, and decreased morale. In this article, we will explore the process of managing change within the context of EdTech.

Walt Disney once said, “Times and conditions change so rapidly that we must keep our aim focused on the future”. A critical component of being a change agent is being forward-thinking and having a growth mindset, focusing on the goal and outcome. Another of Disney’s famous quotes says, “Of all of the things that I’ve done, the most vital is coordinating those who work with me and aiming their efforts at a certain goal”. No one can effect change by themselves, it takes collaboration, knowing your strengths and weaknesses, working together to achieve a common goal, and cultivating and maintaining relationships with those whom you desire to effect change.

Consider the first several weeks of school, educators are building relationships, establishing norms, and learning about each learner’s preferred method of receiving feedback and learning style. These same concepts should be taken into consideration when managing change with adult learners, as these factors don’t just disappear once a K-12 student graduates and/or enters adulthood.

Knowing what is within our sphere of influence and control is another important element of managing change. I was first introduced to the circle of influence after reading Steven Covey’s, The 7 Habits of Highly Effective People. The circle of influence has really stuck with me as it helped me understand and accept what I was able to influence and what I had control over as a change agent, and not worrying about those things that were outside of my control.

As a change agent, the circle of concern are all the things that you are aware of and are concerned about (i.e. district goals, school goals, strategic planning, etc.). The circle of influence is a collaborative area where you play a part in the outcome (i.e. school culture, student centered learning, equitable and accessible learning, classroom EdTech integrations, etc.). The circle of control is a very powerful place, because it is all YOU. Within the circle of control are all the things that you have the individual ownership and ability of managing and changing (i.e. PMA: Positive Mental Attitude, time management, availability for coaching and strategic planning).

graphic showing Hogan's circle of influence
Figure 1: Circle of Influence example from the lens of educational coaches and professional development specialists

During my interview with Prince William County Public Schools, I was asked to pick a topic that I would present on for five minutes. As you probably guessed, my presentation was on the importance of managing change. I’ve revisited that presentation several times over the past six years, but what I’ve realized is regardless of the industry, managing change can be summarized by a few key components:

  • Focus on the Outcomes – you are providing a solution to a need or problem.
  • Be open to feedback – always maintain professionalism and work collaboratively to identify the need.
  • Actively Listen – Use the 80/20 rule (listen 80 percent of the time and speak the other 20 percent), take notes, keep a “parking lot” for any unanswered questions/inquiries.
  • Offer Equitable Solutions – provide solutions that offer choice, equity and accessibility, and differentiation.
  • Prepare & Execute – develop the plan, what implementation/technology framework will be used, key performance indicators, measures of success, and executive of the plan.
  • Have a Follow Up Plan – schedule time for reflection and adjustments.

Understanding what is within your circle of influence and control, fused with these change management components, creates a solution-oriented work team that feels vested in the change management process, and from what I have experienced first-hand, increases engagement and synergy while achieving efficient and effective solutions.

Managing change within the context of EdTech integrations, requires change agents to have a plan of implementation. For this, change agents utilize one or many of the research-based technology integration frameworks that exist. Some frameworks are widely adopted, while others are used by small groups. In either case, change agents should utilize a framework that most effectively meets the needs of the educator and learners. Regardless of the technology integration framework selected, it should always be utilized within the context of the content, pedagogy, learning outcomes and strategies. Remember, the technology exists to support instruction, not replace it.

graphic of the technology integration framework
Figure 2: Technology Integration Frameworks supporting instruction and learning outcomes and strategies

Based on my experience as a change agent along with the different components of change management, coaching, and frameworks in EdTech, I developed the NICE Transformative Coaching© model. This model provides a flexible change management strategy that puts educators in the driver’s seat and gives them an active voice throughout the coaching cycle to determine the most effectives tools and strategies for their learners. The NICE Transformative Coaching model is defined by four main areas:

  • Needs Analysis – this is the initial phase of the coaching cycle; educators are encouraged to take the lead. In this phase, the change agent (coach/trainer), is actively listening to identify the need(s).
  • Identify Tools – once the need(s) have been defined, the change agent will share the EdTech tools that are available that may support the need.
  • Coaching Change – during the coaching phase, educators will develop the plan for integrating the EdTech into their classroom. The change agent should ask clarifying questions, provide data on the tool, and share various frameworks. It is important during this phase that change agents allow the educator to process the information. This may mean a series of follow up coaching sessions as needed while the educator develops or revisits their lesson plans. At the end of the coaching phase, the educator should define if the change agent will be needed to support the execution of the plan, and how the change agent will support.
  • Execute – after the plan has been established, the strategy or plan will be executed. At the end of this phase, there should be time designated for reflections and adjustments; thereby either restarting the coaching cycle.
the NICE transformative coaching model
Figure 3: NICE Transformative Coaching Model©. Created by Takeysha L. Hogan in October 2021

Change is not always easy, but it is inevitable. Having the right mindset and strategies in place and being consistent in those areas, equips educators with the tools needed to focus on solutions, take risks, and innovate; thereby creating a culture that promotes student-centered authentic, equitable, accessible, and engaging learning experiences for students.

References
Covey, S. (1989). The 7 habits of highly effective people: Restoring the character ethic . New York: Simon and Schuster.

Digital Learning Integration Standards of Learning. (2021, October 29). Retrieved from Virginia Department of Education: https://www.doe.virginia.gov/support/technology/standards/index.shtml
The ISTE Standards. (2021, October 29). Retrieved from ISTE: https://www.iste.org/iste-standards

Technology Resources
All graphics were designed utilizing Canva. The word cloud within the technology integration framework graphic was created using WordClouds.com


Written by Takeysha Hogan. Takeysha is a senior training specialist in the Department of Information and Instructional Technology for Prince William County Schools in Northern Virginia. Based on her experiences working in the private sector as well as public education, Takeysha developed a passion for change management, and learning and instructional strategies that promote synergy and community in the workplace and classroom to enhance the learning experiencing for all student and adult learners. For more information, follow her on LinkedIn and Twitter @takeyshahogan

Share this:

  • Email
  • Tweet

Filed Under: Blog, Front Page Middle, VSTE Voices Tagged With: change, Coaching, control, framework, influence

What School Cafeterias Can Teach Us About Student Performance Analytics

November 9, 2021 by timstahmer

Cafeterias, from a time and cost efficiency perspective, are superior to made-to-order food services. We can apply that same “Grab-and-Go” concept to student data – providing real-time analytics and insights that truly support every child, every day.

Cartoon showing hands on various digital devices

The origins of cafeterias as a food service concept can be traced to the 1880s. The New York Exchange Buffet is thought to be the first restaurant to adopt this innovation. The National School Lunch Act of 1946 set the stage for the creation of school cafeterias.

Schools in the 1950s began the widespread creation of school lunchrooms and cafeterias as a food service method. Cafeterias were one of the first self-service business concepts. They have the advantage of allowing a few to serve many with extreme efficiency. School cafeterias prepare and serve hundreds of meals in a short period of time with a relatively small staff. Students select their meal choices, transport their food to tables, and then deliver their plates and cutlery to the dishwashers. Cafeterias, from a time and cost efficiency perspective, are superior to made-to-order food services.

Fast-forward to Self-Serve Data

In 2021, access to student performance data is still mainly on a “made-to-order” basis. Service providers are often the spread-thin school IT workers. With the explosion of computers in the classroom and digital curriculum, the IT team finds themselves no longer in the background but instead on the frontline in the delivery of essential teaching services. With the move to online classes following the COVID-19 pandemic, even greater demands are being made on IT.

Customer self-service is one of the hallmark achievements of the web and yet most organizations are yet to apply this concept to data.

Most data is trapped in silos (apps) and inaccessible to all but those who have the permissions, skills, and software to access raw data and make sense of it. In many cases, that means IT needs to be called in to complete the reporting picture. Most reports utilize data found in multiple apps. In order to use data together from multiple sources, it must be collected in a central location and structured in a common format creating interoperability and comparability. Think about the simple case of comparing student scores from a State administered math assessment to their grades from math class. The State data comes in a nicely formatted file with student names and ID numbers. The grade data comes from the local SIS with student names and ID numbers. All you need to do is match the ID numbers somehow. Sounds good, right? Except when you realize State data and the local data use different ID numbering systems. Now what?

Neither teachers nor IT staff have much extra time. Most educators recognize the importance of making data-driven decisions for the benefit of their students. Performance data for students resides in many disparate applications. A manual “made-to-order” approach to data distribution means that for every request, someone must collect data from disparate sources and then organize it into a report. This type of data delivery has a significant disadvantage in that it introduces many manual steps and thus creates many opportunities for human error. In addition, after the time-lag between sourcing the data, combining it, getting it right and final delivery to the consumer, the information is almost certainly out of date. Fulfilling report requests this way is a slow and cumbersome process and competes for resources from other vital services, forcing greater attention to demand management policies.

What manifests is an odd situation such that there is an inverse correlation between the human effort to produce a report and it's ultimate value.

graph showing a downward curve

The result is what we see in most schools today: the difficulty and level of effort in gaining access to good data deters the ongoing use of data and therefore data-driven instruction. Now more than ever, cost-efficient methods are needed to serve data at scale. Self-service and system automation will recover valuable IT human resources already spread thin and turn the idea of using data to advance learning into a reality.

A Vision for the “Data Cafeteria”

The rapid creation and introduction of instructional tech during the pandemic has created an explosion of data, but the key is putting it to use to address the learning loss and equity gaps we read about in the news every day.

Student data should be integrated – automatically and continuously collected, organized, and loaded into data views that support analysis of educational objectives at all levels.

Access should be provided through a simple and easy-to-use interface. The “data cafeteria” should always be open to its customers stocked with real-time data. No longer should educators need to request reports and spreadsheets be prepared for them. Instead, they should be able to digitally “Grab-and-Go.”

Building a Real-Time Data Service

The first steps in building a real-time data service are similar to how nutritionists design the menus for school cafeterias – school leaders should identify the benchmarks that they want their teams to work towards and clearly identify student performance goals. It’s worth noting these goals could span a broad range of data categories: academic, behavioral, attendance, engagement, social, emotional, etc.

Identify your goals

The objective here is to identify metrics that can be used to track progress toward addressing specific problems or strategic goals important to your schools. Think about goals outlined in your school or district level annual or 90-day plans or both. For example, let’s say you want to address a concern about chronic absenteeism for English language learners at one school and reading proficiency among minority students at another school. Defining “success” in these cases may be straightforward or a nuanced and collaborative effort. This definition process is key as you will see in what happens next.

With specific objectives and a data-informed definition of success, you have the fuel to drive the next part – implementing and using a data service. There are two critical activities involved in this effort: system implementation and building a data culture.

Implement your data service

System implementation involves identifying an internal team to validate and likely an external partner to implement. The internal team will include your IT, accountability, and school leaders who will ensure the right solution is identified and implemented. Your external partner will have experience with deploying student performance analytics in schools. They will work with your internal team to ensure anything deployed not only meets the immediate objectives previously defined but is also flexible enough to address those questions you haven’t asked – in a manner intuitive to your end-users.

In the past, this kind of effort was daunting and only undertaken by large districts with serious IT budgets. The good news is there are powerful solutions in place today which are within reach of even the smallest school districts from a time, cost, and effort standpoint.

Build your data culture

Building a data culture is all about organizational change management. Think about the days before the cafeteria or its ubiquitous cousin, fast food. If you knew nothing but table service, the idea of self-service was an unknown you would probably avoid. When you collaborated with your teams to define “success” around certain metrics, you started the process of building the data culture and removing the fear of the unknown. You were generating a shared commitment to the idea that data will define success. Your system implementation partner should understand this. Beyond just rolling out software, they should be ready to provide the leadership coaching essential to helping you build a data culture. Check out this link to get a better understanding of data culture.

Reaping the Benefits

The initial build-out of a data system will take some time to accomplish, but it should not take too much time. The benefits are both immediate access to the information that educators need to make real-time instructional decisions combined with the elimination of thousands of requests to IT for that very same information. Once data is collected and organized in a central repository, countless insights can be provided continuously and automatically on a self-serve basis. A few views that can be particularly useful are multi-year individual student data portfolios; peer comparisons; and subgroup comparisons.

As schools advance from primarily using data to meet compliance requirements, the promise of providing navigational insights to align school action in support of the education of every child every day will finally be realized.


Logo for ReadWrite Digital

Provided by ReadWrite Digital, a Virginia-based Student Performance Management Solutions company with a dedicated mission: We Make K-12 Education Data Easy. Our team of professionals has decades of experience on the front lines of Education and Technology. Visit our blog to read more insightful K-12 Education Data and Leadership news.

Share this:

  • Email
  • Tweet

Filed Under: Blog, Front Page Middle, VSTE Partners Tagged With: cafeteria, Data, service

Our Edtech Toolbox is Full (for now)

November 5, 2021 by timstahmer

Due to the funding and circumstances resulting from COVID, we have access to more digital tools than ever before in my school district. I am sure most of you are in the same situation. Where in the past we relied on free and/or freemium versions of digital tools, we have purchased premium accounts. We used to dream of being able to afford a division learning management system (LMS) and now it is a reality. It is great to have access to these digital tools that can have a positive impact on teaching and learning. We have to be cognizant of the fact that purchasing these tools via CARES funding means if we want to continue using them, we eventually will have to pick up the tab using local funding. So, for most of us, that is going to be a challenge. So, we have to start looking now at what we keep and what we give up once the subscriptions expire.

The first thing to do is determine how much your tech tools are being used. This can be done in several ways. Our Instructional Technology Resource Coaches are in the buildings so they can see what tools are being used and get feedback from our teachers. We use a program called LearnPlatform that monitors the use of tools, so this provides valuable information as well. Teachers can be surveyed on their favorite tech tools and the ones they feel are the most effective. Keep the survey short and to the point. The most important question to ask is if they have used the tool or not! If so, do they plan to continue to use it? The answers to these questions can be used to help guide staff professional development. Most staff need to be trained on the effective use of the tool.

Other things to consider are: does the tool integrate with your LMS? Is it accessible via Single Sign On (SSO)? Is there another tool that serves the same purpose? (ie. Nearpod vs Peardeck). Finally, reach out to parents/guardians to get their feedback on the digital tools their children are using, as well.

After all the information is gathered, it is time to decide on what tools we abandon once their licenses expire and which ones we work on getting into our operational budget. What tools are effective and make a positive difference when it comes to teaching and learning? Are the vendors working with you on cost? Many school divisions are going to be experiencing this situation and vendors do not want to lose customers, so they will be willing to work with you! So, start doing your work now on identifying what edtech tools you need, so you can, “Choose Wisely.”

Graphic of knight saying choose wisely


Written by Tim Taylor. Tim is the Instructional Technology Supervisor for Shenandoah County Public Schools. He is also the Chair of the Education Committee and a member of the VSTE Board of Directors.

Share this:

  • Email
  • Tweet

Filed Under: Blog, Front Page Middle, VSTE Voices Tagged With: Coaching, edtech, tools

  • « Go to Previous Page
  • Page 1
  • Page 2
  • Page 3
  • Page 4
  • Interim pages omitted …
  • Page 28
  • Go to Next Page »
  • About
  • Blog
  • Events
  • Prof. Services
  • VCC
  • #VSTE25
  • Membership
  • Contact
  • Facebook
  • Twitter
  • LinkedIn
  • YouTube
  • Search

Support

Copyright © 2025 Virginia Society for Technology in Education · Log in